
$16 Billion in U.S. Insect Dependent Exports: Discussion on Citrus, Cocao, and Other Fruits

Figure 1: Top 10 countries by value of pollinator-dependent exports, 2021. The U.S. ranked first, accounting for the largest share of global pollinator-dependent exports, valued at $16.17 billion.
Introduction
The analysis of U.S. 2021 export data reveals that the U.S. is the world's largest pollinator-dependent exporter globally at $16.17 billion dollars in 2021 (Figure 1). This $16.17 billion in total pollinator-dependent exports exceeds the individual export values of aircraft parts, beef, and medical appliances, demonstrating the strategic importance of these trade flows within the US export portfolio. The 2021 analysis also reveals that three specific categories of US exports of pollinator-dependent crops – citrus, other fruits, and cocoa –generated $3.88 billion in exports (The Observatory of Economic Complexity).
The analyzed categories of cocoa ($1.91 billion), citrus ($903 million), and other fruits ($1.07 billion) represent approximately 24% of total US pollinator-dependent export activity, indicating that the present analysis captures less than one-quarter of the nation's economic exposure to pollinator decline. This $16.17 billion in U.S. exports depends on pollination. Pollination is the process by which pollen is transferred from one flower’s anther to another flower’s stigma, allowing plants to reproduce.
Without pollination, most plants would be unable to reproduce, resulting in fewer seeds for a new generation of plants, which would significantly reduce plant populations and the genetic diversity necessary for ecosystems to adapt and remain resilient, particularly in the face of climate change.
Pollination can occur through various means, including wind, insects, animals, or even water. However, more than 80% of flowering plants and about 75% of all staple crops depend on animal pollinators (USDA).
For example, U.S. cocoa ($1.91 billion) exports depend entirely on tiny midges measuring less than 4 millimeters—the only pollinators capable of fertilizing cacao flowers. This dependency illustrates a fundamental but often overlooked reality: natural ecosystem services form the invisible foundation of international trade and national economic competitiveness.
The economic value of pollination services remains largely unmeasured despite supporting entire agricultural sectors worth billions of dollars.
With wild pollinator populations declining, the economic implications remain poorly quantified at the national scale (Penn State Uni., USDA). Existing studies typically focus on individual crops or regional analyses, failing to capture the aggregate economic exposure within national trade portfolios. This quantification gap creates a blind spot for policymakers who must weigh conservation investments against other economic priorities without clear understanding of the financial stakes involved. Furthermore, the lack of standardized economic valuation methodology limits the integration of pollinator services into national economic accounting systems, rendering these services economically "invisible" despite their material importance to agricultural output and export competitiveness.
In this study, we address a specific, quantifiable research questions:
-
What is the measurable economic value of pollinator services embedded within US agricultural exports?
-
How much of this value faces direct risk from pollinator decline?
Rather than attempting to estimate total domestic agricultural value, this analysis focuses on the more tractable question of export value at risk. We examine three major categories of pollinatordependent agricultural exports—cocoa products, citrus fruits, and other fruits.
Nevertheless, even this conservative analysis demonstrates that pollinator services support quantifiable economic value equivalent to the GDP of several small nations, providing an empirical foundation for evaluating conservation investments and agricultural risk management strategies
This paper proceeds through five analytical stages to establish the economic value of pollinator services within US agricultural exports.
Following this introduction, Section 2 describes:
-
the methodology, including data sources,
-
crop selection criteria, and
-
the derivation of pollinator dependency coefficients from agricultural science literature. Section 3 describes:
-
the results,
-
quantifying export values,
-
risk exposure across crop categories while establishing the US position in global markets.
Section 4 discusses:
-
the implications of these findings, and
-
contextualizing the $2.73 billion at-risk value within broader economic and ecological frameworks while acknowledging significant underestimation factors.
Section One
Methodology: Integration of Trade and Economic Statistics
This analysis integrates agricultural trade data from the Food and Agriculture Organization (FAO) Trade Statistics with national economic data from the World Bank World Development Indicators to establish baseline economic relationships. Export value data were extracted from three FAO Trade Statistics CSV files covering 2021 trade flows: "Export Cocoa 2021.csv" (199 countries), "Export Citrus 2021.csv" (169 countries), and "Other Fruits 2021.csv" (179 countries).
GDP data were obtained from the World Bank's World Development Indicators database (indicator code NY.GDP.MKTP.CD), providing 2021 national GDP figures in current US dollars for comparative analysis. Trade data were supplemented with market intelligence from the Observatory of Economic Complexity (OEC.world).
The OEC database offers insights into trade dynamics beyond simple export values. For the analyzed commodities, OEC data reveals that cocoa products rank among the most geographically concentrated exports globally, with the top 5 exporters controlling over 70% of global trade.
This concentration amplifies the economic significance of pollinator services, as disruption in major producing regions could trigger substantial price volatility in global markets. Conversely, OEC data shows that fruit exports exhibit greater geographic distribution, potentially providing more resilience against localized pollinator decline.
Crop Selection
Crop selection followed three primary criteria:
-
Commodities were selected based on clear pollinator dependency relationships established in agricultural science literature, avoiding crops with ambiguous or disputed pollination requirements.
-
Selected categories required sufficient export volume to generate meaningful economic signals within national trade statistics, excluding minor specialty crops despite potential high pollinator dependency.
-
FAO Trade Statistics classification systems provided standardized commodity codes enabling consistent international comparisons.
Cocoa and cocoa products (HS Codes 41801, 41802, 41803, 41804, 41805, 41806) were selected due to their extreme pollinator dependency and substantial US export volumes. Theobroma cacao exhibits obligate outcrossing with specialized pollination requirements fulfilled exclusively by Ceratopogonidae midges (Forcipomyia spp.).
Citrus fruits (HS Code 20805) represent moderate dependency relationships with established alternatives (Monasterolo et al.). While Citrus species can achieve some fruit set through selfpollination, cross-pollination significantly enhances yield quantity and fruit quality. OEC data confirms that citrus exports involve substantial intra-industry trade, with processed citrus products commanding premium prices in international markets. Their value is potentially lost if pollinator decline reduces fruit quality even without eliminating production entirely.
The "other fruits" category (HS Code 20810) captures the diversity of pollinator-dependent fruit production while maintaining analytical tractability. This category includes apples (90% pollinator dependent), berries (40% to 90% dependent), and stone fruits (variable dependency).
Scientific Basis for Economic Risk Assessment
Pollinator dependency coefficients represent the core methodological innovation enabling translation from biological relationships to economic risk assessment. These coefficients quantify the proportion of agricultural output directly attributable to animal pollination services, derived from controlled pollination exclusion experiments and observational studies in agricultural science literature, see e.g. Garrett et al[1].
The cocoa dependency coefficient of 0.90 reflects near-complete reliance on midge pollination for commercial cacao production. Field studies consistently demonstrate that cocoa yields decline by 80% to 90% in the absence of Forcipomyia midges, with remaining fruit set attributed to rare autogamy events. Critically, no viable artificial pollination alternatives exist for cacao at commercial scale, as the flowers measure only 1 centimeters to 2 centimeters and require precise timing for successful fertilization. This biological constraint creates a direct 1:1 relationship between pollinator availability and economic output.
Citrus dependency coefficients of 0.35 reflect moderate pollination enhancement rather than absolute requirement. Controlled studies demonstrate that citrus yields improve by 18% to 35% with cross-pollination compared to self-pollination alone, while fruit quality measures (sugar content, size, seed development) show more dramatic improvements of 40% to 60%. The economic coefficient captures both quantity and quality effects, acknowledging that export market premiums often depend on fruit quality characteristics enhanced by effective pollination. The "other fruits" coefficient of 0.65 represents a weighted average across diverse crop types with varying pollination requirements. Apples exhibit 90% dependency while blueberries range from 40% to 90% depending on variety and growing conditions. Stone fruits typically show 40% to 60% dependency, with significant variation based on self-compatibility characteristics. The 0.65 coefficient reflects the export portfolio composition of US fruit trades, weighted toward higherdependency crops like apples and berries that dominate US fruit export value.
Calculation Framework: Export Value Risk Assessment
The economic risk assessment employs a direct multiplication framework: Export Value × Dependency Coefficient = Value at Risk. This approach assumes that pollinator service disruption would reduce export values proportionally to biological dependency relationships, representing a conservative estimate that excludes potential price effects from supply disruptions.
For each crop category, the calculation proceeds as follows:
-
Cocoa: $1.910 billion x 90% = $1.72 billion at risk.
-
Citrus: $903 million x 35% = $316 million at risk.
-
Other Fruits: $1.07 billion x 65% = $695 million at risk.
-
Total Risk: $2.7 billion at risk across the three categories.
Note: These are estimates with calculations varying due to other unrelated criteria.
This framework explicitly excludes several potential amplification effects that could increase actual economic impacts. Price elasticity effects are not modeled. If US production declined while global demand remained constant, export prices might increase, partially offsetting volume losses. Conversely, if multiple producing countries experienced simultaneous pollinator decline, global supply disruptions could generate price volatility exceeding the direct production effects captured in dependency coefficients.
Limitations: Scope Constraints and Underestimation Factors
This analysis acknowledges significant scope limitations that likely result in substantial underestimation of true economic exposure. The three analyzed crop categories represent only a subset of pollinator-dependent US agricultural exports, excluding nuts (almonds alone exceed $5 billion in annual exports), vegetables (cucumbers, squash, melons), oilseeds (sunflower, canola), and numerous specialty crops with high pollinator dependency.
Geographic scope limitations also constrain the analysis. Export data capture only international trade flows, excluding the much larger domestic agricultural economy where pollinator services support food production for 331 million US consumers. Additionally, the analysis excludes indirect economic effects through agricultural supply chains, food processing industries, and employment multipliers that could amplify the direct production impacts quantified here.
Temporal limitations restrict the analysis to a single-year snapshot, preventing assessment of trends, volatility, or long-term structural changes in pollinator-dependent trade.
Finally, the methodology assumes linear relationships between pollinator availability and economic output, when ecological research suggests threshold effects and non-linear responses may characterize pollinator-crop relationships under stress conditions.
Section 3
Results
The 2021 analysis reveals that US exports of pollinator-dependent crops in the three analyzed categories generated $3.88 billion in international trade value. However, this narrow analysis significantly understates the broader economic significance of pollinator-dependent trade. US pollinator-dependent exports total $16.17 billion annually across all categories. The U.S. is therefore the world's largest pollinator-dependent exporter globally. This $16.17 billion in total pollinator-dependent exports exceeds the individual export values of aircraft parts, beef, and medical appliances, demonstrating the strategic importance of these trade flows within the US export portfolio.
The analyzed categories of cocoa ($1.91 billion), citrus ($903 million), and other fruits ($1.07 billion) represent approximately 23.9% of total US pollinator-dependent export activity, indicating that the present analysis captures less than one-quarter of the nation's economic exposure to pollinator decline (Figure 2).
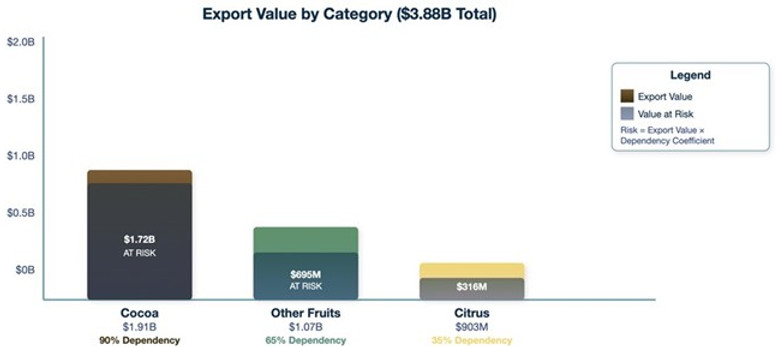
Figure 2: Export Value of Pollinator-Dependent Exports in the U.S. The total value, worth $3.88 billion, has faced risk due to pollinator population declines.
Cocoa: Critical Dependency and Maximum Economic Exposure
Cocoa exports face the highest absolute economic risk, with $1.72 billion in export value (90% of $1.91 billion) directly vulnerable to pollinator service disruption. This vulnerability occurs within the broader context of planetary boundary transgression, with biodiversity integrity showing severe degradation according to Responsible Alpha's framework analysis. The complete dependence on Ceratopogonidae midges creates what ecologists recognize as an obligate mutualism—a biological relationship that cannot be replicated through technological intervention.
Global cocoa market concentration amplifies this vulnerability within the context of nature-dependent trade flows. According to Responsible Alpha's global analysis, nature-dependent soft commodity exports represent 0.7% of total global trade, yet support economic activity equivalent to the GDP of 154 nations. The US position in processed chocolate products, rather than raw cocoa beans, provides some buffer against supply disruptions but creates exposure to upstream ecological collapse in major producing regions.
Quality effects compound the quantitative risks for cocoa exports within increasingly stressed planetary systems. As biodiversity integrity declines globally, pollinator effectiveness in cocoa-producing regions faces mounting pressure from habitat fragmentation, climate change, and agricultural intensification. Export-grade cocoa commands 20% to 40% price premiums over domestic consumption grades, suggesting that ecosystem degradation could trigger disproportionate value losses if declining pollinator effectiveness forces quality downgrades.
Other Fruits: High Variability and Diversified Risk in Global Context
The "other fruits" category faces $695 million in at-risk export value (65% of $1.07 billion), reflecting heterogeneous pollination requirements across diverse fruit crops. Over 80% of flowering plants and 75% of staple crops depend on pollination services, with 60% to 70% of plants relying specifically on insect pollination where bees are key.
Apples represent the largest component within this category, contributing significantly to the broader $16.17 billion in total US pollinator-dependent exports identified by Responsible Alpha.
Washington State apple production alone generates over $2 billion annually, with export markets demanding consistent quality achievable only through effective cross-pollination between cultivars. The global context of declining bee populations, creates systemic risk to apple export competitiveness.
Berry exports exhibit particular vulnerability within the context of accelerating biodiversity loss. Blueberry, cranberry, and strawberry production depends heavily on native bee species increasingly threatened by habitat conversion and agricultural intensification. These crops target premium international markets where appearance, size, and flavor characteristics directly reflect pollination effectiveness, creating potential for catastrophic value losses if ecosystem degradation forces producers to compete in lower-value commodity segments.
The geographic distribution of fruit production provides limited protection against the systematic ecological pressures identified in planetary boundary analysis. Climate change, land use conversion, and pollution, affect pollinator communities across multiple regions simultaneously, potentially overwhelming geographic diversification benefits through synchronized disruption patterns.
Citrus: Moderate Dependency with Quality Premiums Under Ecosystem Stress
Citrus exports face $316 million in direct risk (35% of $903 million), representing the lowest proportional vulnerability among analyzed categories. However, this moderate dependency calculation understates potential impacts within the broader context of ecosystem service decline. Cross-pollination significantly enhances citrus characteristics valued in export markets: larger fruit size, higher sugar content, reduced seed development, and improved juice quality parameters essential for competing against lower-cost international suppliers.
The US citrus industry's export focus on premium segments creates disproportionate vulnerability to quality degradation from declining pollination effectiveness. Florida orange juice exports compete primarily on quality rather than volume against international suppliers, while California lemon exports command premium prices based on consistent appearance and taste characteristics. Within the context of global biodiversity collapse, pollinator decline could force US citrus producers toward lower-value market segments, generating losses exceeding the calculated 35% direct dependency.
Regional concentration of citrus production creates additional vulnerability within the context of multiple planetary boundary transgressions. California's Central Valley and Florida's citrus belt face simultaneous pressures from climate change, freshwater stress, and agricultural intensification. These converging environmental stresses could generate cascading impacts on pollinator communities, amplifying economic risks beyond those captured in single-factor dependency calculations.

Figure 3: Risk–return analysis comparing export value and pollinator dependency. Cocoa faces the highest risk, followed by other fruits and citrus.
Section Four
Aggregate Risk Assessment For Three Categories
The aggregate analysis identifies $2.73 billion in direct export value at risk from pollinator service disruption across the three analyzed categories, representing 16.9% of the total $16.17 billion in US pollinator-dependent exports.
The broader context of planetary boundary transgression amplifies these direct calculations through multiple pathway interactions. With six of nine planetary boundaries already exceeded, pollinator decline occurs within a broader pattern of ecosystem service degradation that could generate compound and cascading economic impacts across multiple sectors simultaneously.
Risk concentration analysis within the global context reveals concerning vulnerabilities. Critical dependency crops (cocoa) account for $1.72 billion (63%) of analyzed at-risk value, reflecting biological constraints that cannot be addressed through technological substitution. High-variable dependency crops (other fruits) contribute $695 million (25%), while moderate dependency crops (citrus) represent $316 million (12%). This distribution occurs within the broader context of global biodiversity collapse affecting 60% to 70% of plants that rely on insect pollination.
The $2.73 billion at-risk value represents a conservative baseline that excludes numerous amplification factors operating within stressed planetary systems. Domestic consumption value, processing industry investments, employment effects, and supply chain disruptions could multiply direct trade impacts significantly. Additionally, the analysis excludes nuts (almonds alone exceed $5 billion in annual US exports), vegetables, oilseeds, and specialty crops, suggesting that comprehensive pollinator-dependent risk assessment could identify economic exposure measuring in tens of billions of dollars.
International competitive dynamics within the context of global ecosystem decline create additional complexity beyond direct production impacts. The US position as the largest pollinator-dependent exporter provides potential strategic advantages if conservation investments maintain ecosystem service stability while competitor nations experience degradation. However, if US ecosystem services decline while international competitors maintain stability through superior conservation strategies, market share losses could substantially exceed the direct production impacts quantified in this analysis.
Discussion
The competitive implications of pollinator decline extend beyond direct production impacts through complex international trade dynamics occurring within the context of unprecedented biodiversity loss. With six of nine planetary boundaries already exceeded, pollinator communities face systematic pressure from multiple converging threats that amplify economic risks beyond historical precedent.
The widespread use of nature-adverse fertilizers, particularly neonicotinoid pesticides, has generated systemic toxicity in agricultural landscapes where pollinators forage. Systemic chemicals persist in plant tissues for months, and create chronic exposure scenarios that impair pollinator navigation, memory, and reproductive success even at sublethal concentrations.
Habitat destruction represents the most significant driver of pollinator decline, with agricultural intensification eliminating 33% of global forest cover and fragmenting remaining natural ecosystems. The conversion of landscapes into monoculture production systems removes the floral diversity required to support healthy pollinator communities throughout seasonal cycles. The loss of habitat affects specialist pollinators like the Ceratopogonidae midges essential for cocoa production, which require specific microhabitat conditions unavailable in simplified agricultural environments.
Climate change compounds these pressures through disruption of seasonal timing relationships between flowering plants and pollinator emergence. Temperature increases of 1-2°C can desynchronize pollination relationships evolved over millennia. Extreme weather events increasingly destroy pollinator nesting sites and overwinter habitat.
Future research should extend this methodology to capture economic exposure across all pollinator-dependent sectors. Dynamic models that incorporating temporal trends, climate change projections, and international competitive effects would significantly improve the forecast quality of this analysis. The quantitative framework demonstrated here provides a foundation for such expanded analysis and offers paths to policy guidance for conservation investment priorities based on demonstrated economic returns.